Top Ten Metrics You Need To Measure Productivity

Follow @ankurkumarz Follow @VedcraftTeam
Measuring & tracking the progress of any program is key to success as quoted in the famous saying:
If you can’t measure it, you can’t improve it.
Considering a large number of metrics available, this article summarizes the top ten metrics to measure from the delivery team’s productivity perspective:
| Metric | Purpose | Description |
|---|---|---|
| Feature Cycle Time | To measure the time-to-market of a feature to generate business value and denotes the velocity of the team. | |
| It also helps to find out inefficiencies within the team or technology, which can provide visibility to take strategic measures. | Cycle time from Definition of Doneness to Go Live. It is usually measured in days/weeks. | |
| Feature Cycle Time = Implementation End Date – Implementation Start Date | ||
| Number of Releases | To measure team’s ability to support time-to-market business needs | Number of releases in a month, week or a day |
| Sprint Predictability | To measure predicted vs. actual delivery commitment. Program management can use this metric to improve future Sprint’s projection & improve upon providing more realistic timelines to senior stakeholders. | Number of committed stories delivered / Total number of committed stories |
| Functional Test Execution Time | To measure the time taken to run the progression testing suite as well as regression testing suite. The shift-left strategy applied to ensure functional testing is fast to detect issues early. | Time taken to execute the testing suite (progression & regression) |
| Defect Removal Efficiency (DRE) | To measure the productivity of the development team to remove defects prior to release. | Number of defects resolved by the development team / total number of defects at the moment of measurement. |
| DRE= (Number of defects found internally/ Number of defects found internally + Number of defects found externally) × 100 | ||
| Code Build Time | To measure the DevOps maturity level and ensure that team’s efficiency is not impacted by it. | Time required to build the deployable packet, passing all gates of Continuous Integration cycle (incl. code quality, security & performance testing, sanity testing, etc.) |
| Release and Deploy Time | To measure the DevOps maturity from a continuous deployment perspective. | Time required to release the packet on production like cluster and bringing the services back for use. |
| Time to create a new environment | To measure the DevOps maturity to build a new environment to enable the development team to focus on issue resolution. The process should be as close to possible as used for a production environment. | Time it takes to new environment for development team. It is measured in minutes or seconds. |
| Time to Fix a Broken Build (Mean time to repair – MTTR) | It reflects how quickly an organization or team can respond to system issues or defects and fix them. It also denotes the architecture & design maturity to enable the team to resolve issues quickly. | Time lag between broken (including compilation or quality gate failure) build to the fixed build. |
| MTTR = Total time to repair / Total number of repairs | ||
| MTBF (mean time between failures) | To measure the reliability of the system and architecture & design maturity of the system under consideration. | |
| It measures how effectively the team is using SRE practices. | The “up-time” between two failure states of a repairable system during operation. It is typically represented in hours. The higher the MTBF number is, the higher the reliability of the system. | |
| MTBF = Total uptime / # of breakdowns |
You can also measure the maturity level of your practices for the above metrics. Maturity model definition can vary as per your organization and here is a sample maturity model definition for reference:
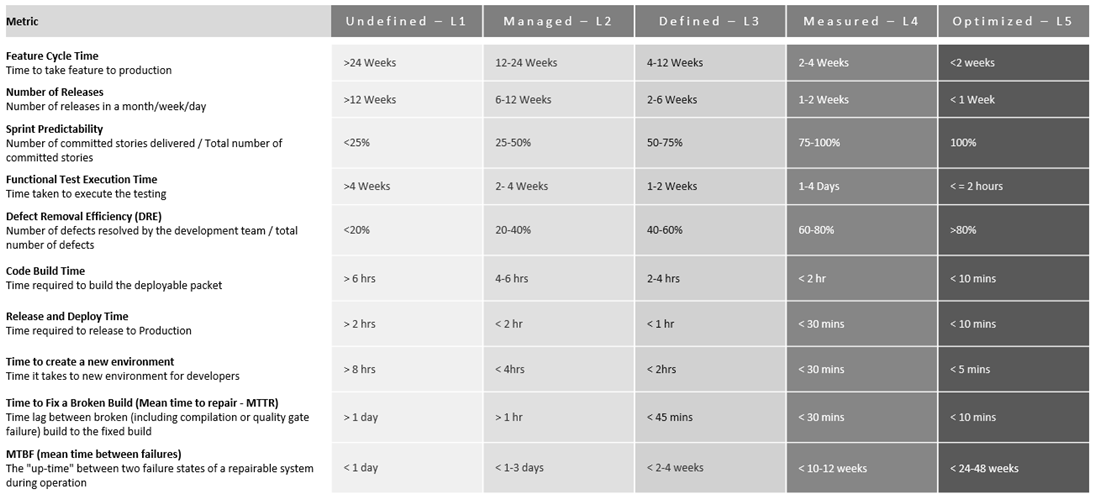
Reference: Maturity Model for Productivity Metrics
Comments
thanks for the list. one thing we are struggling on measuring the productivity of the labs is that each project/product is different. also each metric alone contains ambiguity ( or lab can game the system). The ultimate goal for us is to find a best balance point of speed and quality which we call it “definition of good-enough”. It is a art than science. We also measure a few more items. – wait time between QA sign-off and deploy to prod. This is to help us to identify the wait time. It is not so much a issue for the lab, but it is a agility issue. — prod Incident frequency: This is to measure how often end user experience the issue. of cause the less the better. — unit testing time spent: It is a dilemma. some developer does not do enough unit testing. we cannot say shorter is better. there is no clean cut. — No touch operation: This is to measure how busy our op team is. Ideally they should not be busy to duck-tape the system here and there to keep it running.
Hi, I didn’t found any reference for Maturity Model for Productivity Metrics, where Can I find the rationale behind those numbers?